
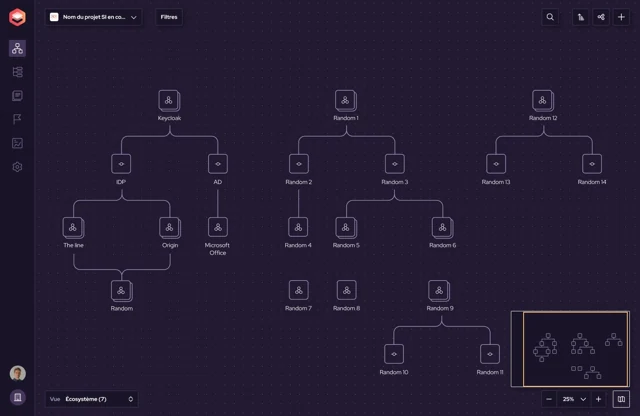
Start from the data, build the views
An application, a server or a process is described once in the repository. The views then offer several readings of this information. You can enrich objects and their relationships as your knowledge of the information system grows.
- Inventory the components and fill in their characteristics.
- Link objects to document dependencies.
- Explore a scope and adapt the reading to the needs of the person you are talking to.
Six layers to connect business and infrastructure
Cartographit organises the map into six complementary layers. The starting point depends on the data you have and on your objective. The Container layer is useful when your architecture lends itself to it.
- Ecosystem: Identify the internal and external entities that interact with your information system: departments, customers, suppliers and partners.
- Business: Describe the processes and the information they handle, to put the technology back into its business context.
- Application: Represent the applications, their data stores and the data flows they exchange.
- Container: Document the pods, the pools and their flows when your environment uses containers.
- Logical Infrastructure: Locate the logical servers, networks, subnets and network flows that support your applications.
- Physical Infrastructure: Locate the equipment across your organisation’s sites, buildings, rooms and racks.
Adapt the repository to your organisation
Custom fields let you complete the characteristics of objects. Before adding a field, define the question it must answer, who fills it in and how it will be kept up to date.
- Keep a common naming convention.
- Choose a level of detail that is useful to the teams.
- Assign responsibilities for shared information.
Collaborate with the right access
Advanced and Expert offer rights management per project. Expert also lets you manage rights per layer. Teams can thus contribute to the same repository while keeping control of access to the different scopes.
Present your findings and track maturity
Cartographit offers architecture reports to document the information system and maturity-level tracking based on the ANSSI guide. These features complement the graphical views to structure the approach and share information.
Use the map day to day
Search, inventory views and graphical representations meet complementary needs. Imports and exports make it easier to reuse and present information. Saved positions let you return to the layouts you have prepared.
Analyse your information system and organise actions with Studio
Cartographit describes your information system and its dependencies. Studio uses this information to identify the points to check, understand the consequences of an outage and prepare the actions to take. It is included in every plan.
Each of its six modules meets a specific need. The Rapports area then lets you download and share the results, with their limits. These analyses depend on the information recorded in your map and do not constitute a declaration of compliance.
- Carto Sentinel: identify and rank the security points to check.
- Registre RGPD: prepare a register from the known information, to be completed and validated with your teams.
- Analyse d’impact & PRA: simulate an outage and identify the applications and activities that could be affected.
- Qualité de la cartographie: spot missing or inconsistent information.
- Plan d’action: organise the actions, their owners and their due dates.
- Matrice de flux: check that the exchanges declared between applications are also described at container and infrastructure level.